Temperature And Speed
January 22nd, 2021
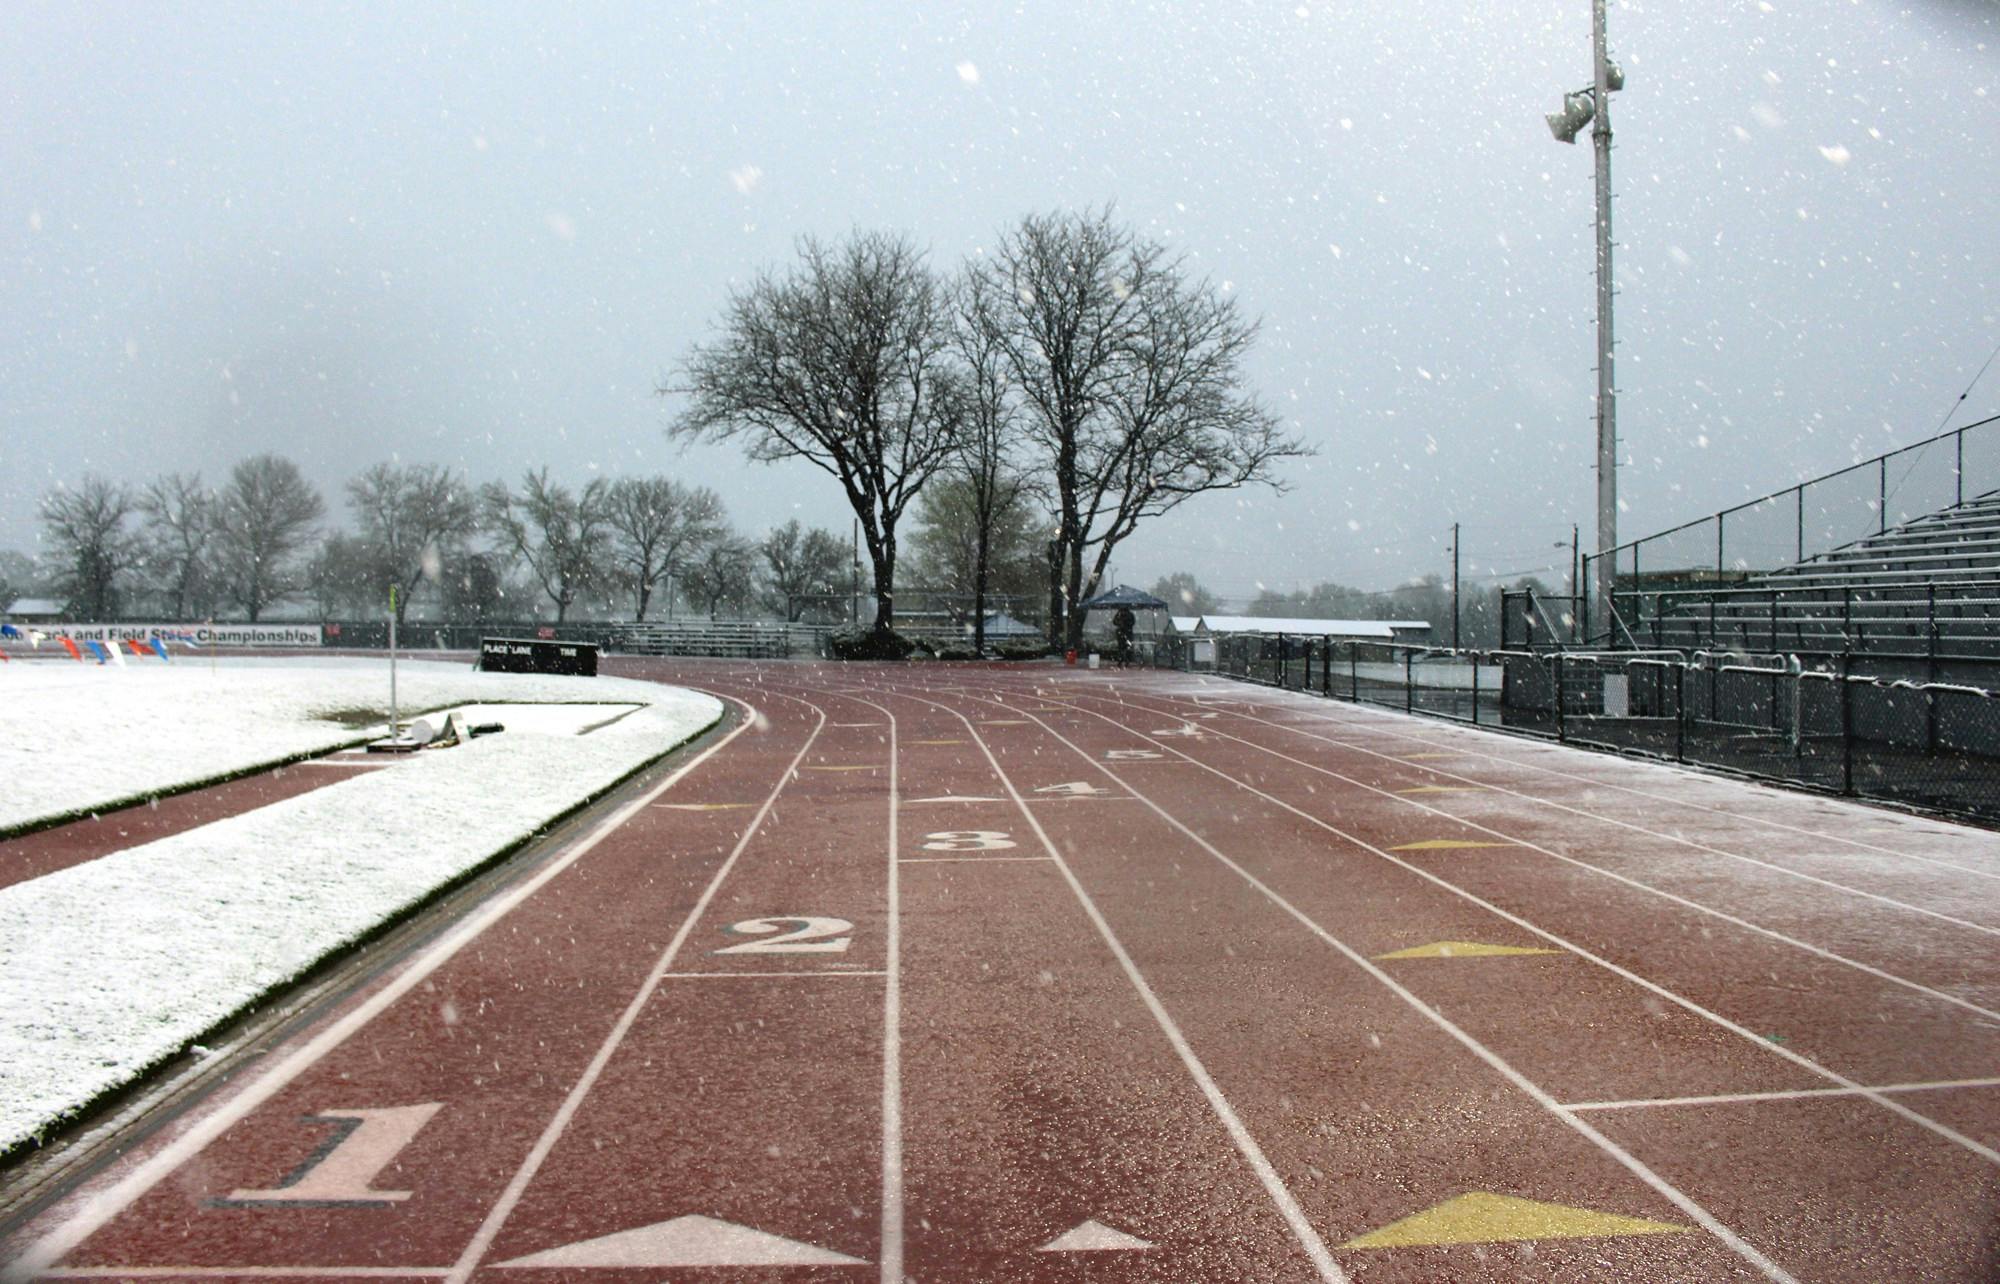
At CMU, our outdoor season typically started in the beginning of March. March in Pittsburgh is, well, freezing. We were lucky if our home meets weren’t cancelled for having ice or snow on the track. All in all, March was my least favorite month in college. It always felt harder to warm up and hit top speed at these cold meets. I struggled to match my indoor times, which, because of the tighter turns, are typically a second slower for the 200m and even more for the 400m.
What made me slower during March? Was my warmup not thorough enough for the cold weather? Was it fear of injury? Could it be just decreased intensity coming off of indoor championships? I couldn’t find any specific research about sprint performance and temperature. Without a way to gather more data, I was stuck.
That changed last year when I bought a Freelap.
I originally bought my Freelap because I wanted to run automatically-timed time trials without track meets to attend. However, I quickly incorporated it into my workouts as well: timed thirty-meter flies have become my bread-and-butter workout. 2-3 times a week, I’ll run between 4 and 7 flies with full recovery with a 30-40 meter acceleration zone. I put each rep along with some workout metadata into a Google sheet afterwards for analysis.
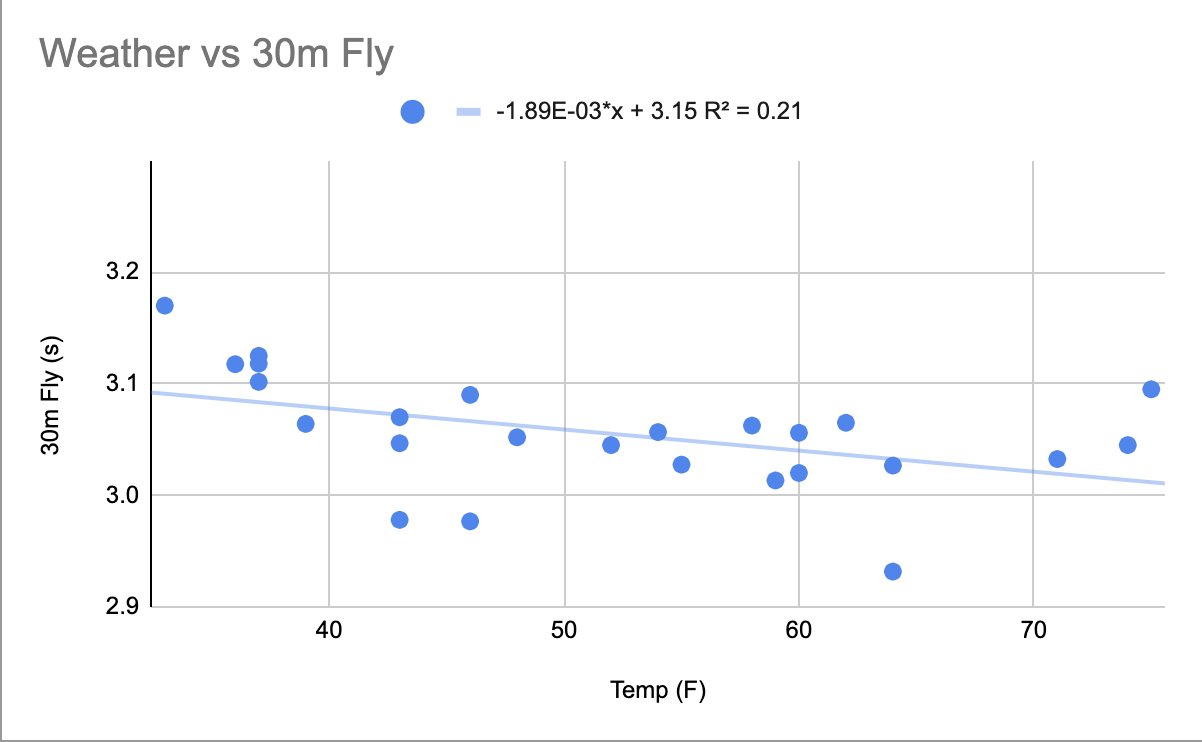
As temperatures decreased going into the winter, I noticed that my fly times were slowing down, despite breaking a sweat with each warmup. But my times weren’t always slower. I noticed that when the days were unseasonably warm (thanks California) or when I had a chance to run later in the day, I was consistently running faster and even setting PRs. This reminded me of my old March woes. Since I had all of my fly times over several months, I graphed my average fly time per workout against temperature and found a fairly strong correlation (r^2=0.21):

No other variable I tracked had an r^2>0.05, including my bodyweight, the date of the workout, and WHOOP metrics like Recovery and sleep.
What does this mean? Obviously, this self-experiment is fairly unscientific: I had a sample size of a single unblinded athlete. I’ve also only been able to track about 150 reps across 25 workouts. If you take the data at face value, however, there are some implications:
-
Cold weather means slower running. Each 10 degree drop slows my 30m fly times by about 0.02 seconds—a significant amount, especially across 100 meters or more.
-
Training in cold weather, however, can still produce results: I set 60m and 100m PRs after this past block of training (I waited for warm days for these time trials).
-
An
r^2of 0.21 is significant, but still means that 80% of speed variance is explained by factors other than temperature. You might be at a disadvantage racing in the cold, but it doesn’t mean that you can’t still perform. A good warmup, proper sleep and nutrition, and thoughtful training plan will set you up for success, no matter the temperature.
