
Calculating World Athletics Scoring Table Coefficients
April 26th, 2022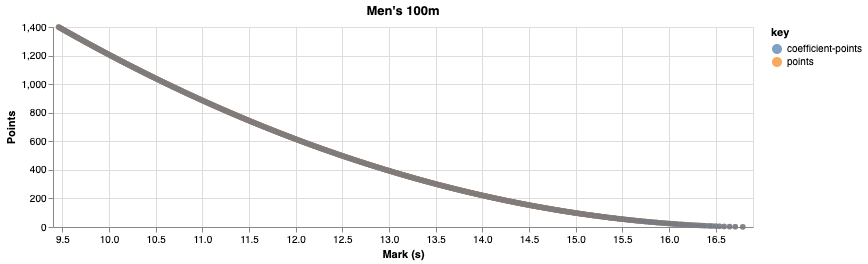
I’m often asked by non-athletes what my mile time is when I tell them I’m a sprinter. Although there’s no true comparison, I’ve typically used World Athletic’s scoring tables to get a relatively close mark. For example, my 100m PR of 10.71 and a mile time of 4:08.41 are both worth 974 points. I’ve used this calculator based off of the 2017 tables for a long time, but the calculator hasn’t been updated with the 2022 data.
So, naturally, I built my own. Check it out if you haven’t already; the remainder of this post will dive into my methodology for parsing the World Athletics PDFs and fitting a curve to each category/gender/event tuple.
PDF Parsing
I built off the code I wrote when studying the effect of lanes on the 200m. The scoring table PDFs were much more structured than Diamond League results, but my data structure of choice was much more nested, so the parsing complexity netted out to be about the same. That code lives here; it basically creates a nested data structure data[category][gender][event] with an array of (mark, point) tuples. Because the parsing takes a while to run, I saved the data as a flat JSON file here (warning: big file).
Curve Fitting
Although that file compresses down from 17 to about 1.3MB, 1.3MB is still a lot to send down in a network request. I figured that the tables were likely based off some equation, and found this StackExchange Q&A with details. Which was lucky, because I’m bad at math and definitely wouldn’t have been able to derive it myself.
Even knowing the formula, I had no idea how to fit a bunch of points to it. Once again, Google saved me with this implementation of a polynomial regression. All I had to do from here was convert that code to Clojure and fit some curves. Validation was easy because the regression also gives us an R^2 number; the R^2 for each event was >0.999. That said, one caveat of the fit curves is that it doesn’t take floor into account—this is likely what prevents an R^2 of 1, and creates one-point discrepancies in many places.
Because of that discrepancy, I tried ceil, floor, and round to see which would produce the most accurate measurements:
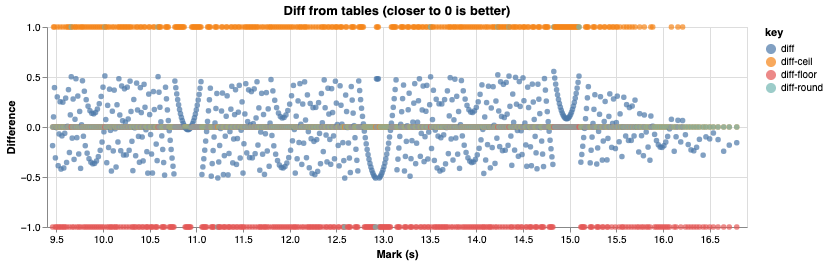
Clearly, round is the best choice here. This is corroborated by the least squares error of each method:
{:diff 50.36689399667615 ;; no rounding
 :diff-floor 329.0
 :diff-ceil 323.0
 :diff-round 12.0}
Once again, you can find the points calculator here and the code for the parsing and curve fitting here.