
"No true science"—altitude, venue effects, and the fastest indoor track in America
September 2nd, 2026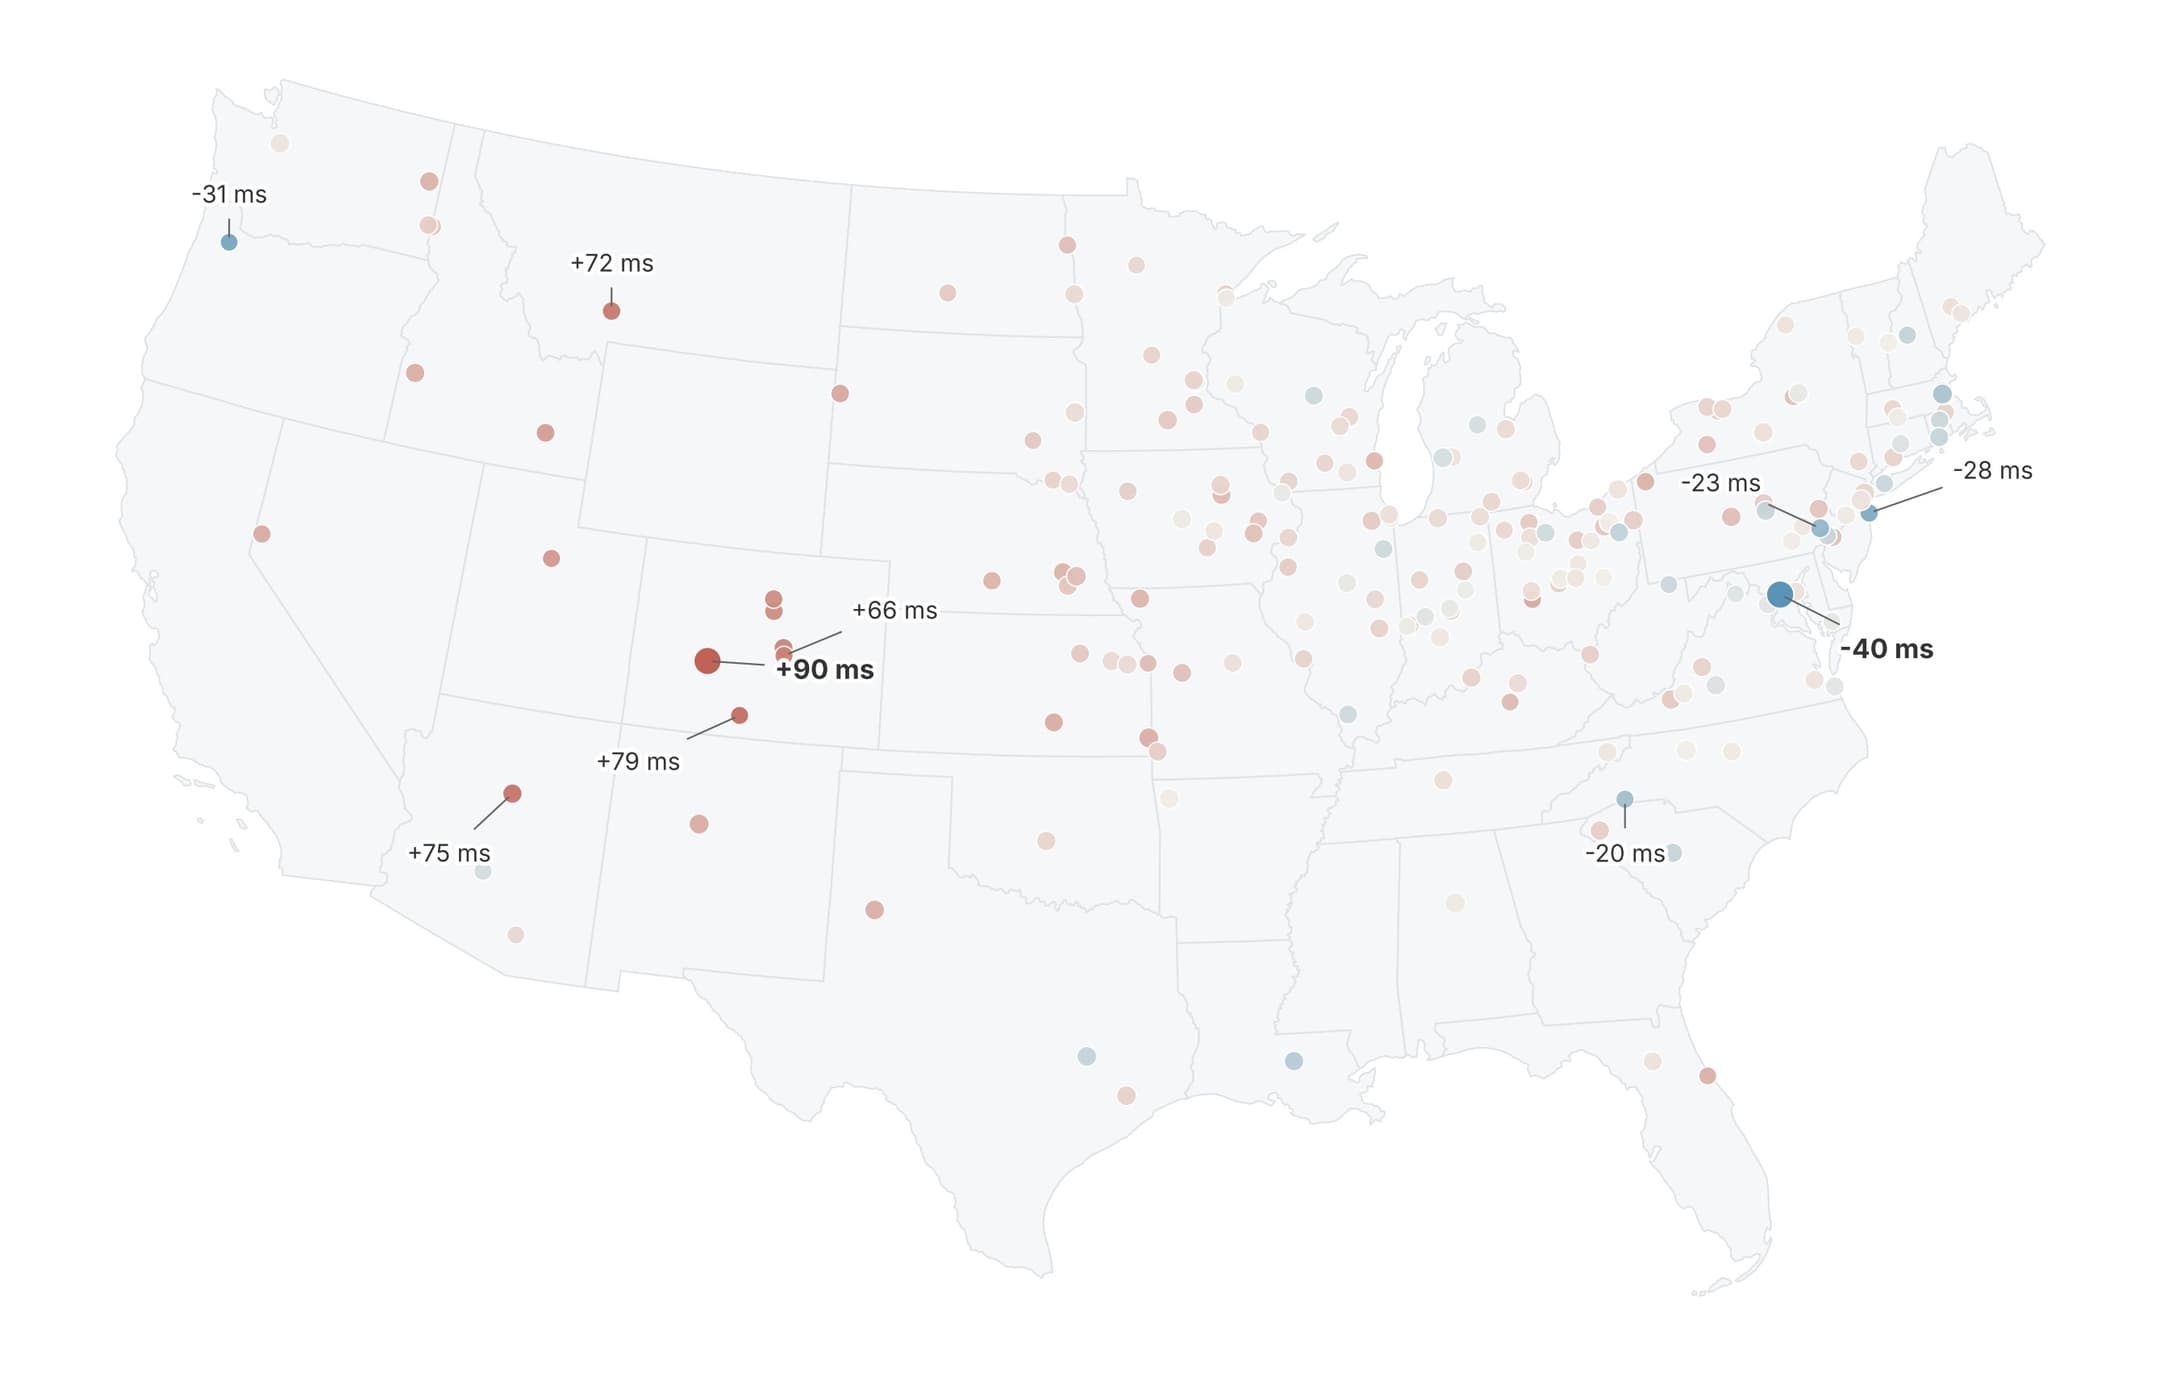
This summer, NCAA Division I voted to remove altitude and track-size conversions, which had been in place since 1981, claiming that “there is no true science being applied.” Division II is poised to follow in 2027–28, endorsing a letter from the president of the coaches’ association claiming that “the data behind altitude conversions are rife with inaccuracies, and were not developed based on scientific evidence.”
I acquired every TFRRS 60 m and 60 mH result from 2007–2026. The data clearly show that 1) altitude significantly benefits short sprinters, 2) the old NCAA adjustments were about 2x too small, and 3) measurable venue effects remain after accounting for altitude. In fact, the model estimates that the fastest track in America is 90 ms faster over 60 m than the median sea-level venue—enough to vault 2026’s 73rd-fastest 60 m athlete into the top 16 and a ticket to NCAA nationals.
True Science
Our dataset, after filtering out invalid data such as global and athlete-level outliers, contains roughly 519,000 race results across 204 venues and 175,000 athlete-seasons. This sample gives us plenty of statistical power to estimate altitude’s effect on sprinters.
These effects are reasonably well-studied. The physical intuition is basically: 1) short sprints are purely anaerobic, so there’s no disadvantage from the decrease in oxygen availability, and 2) air density drops with altitude, decreasing drag forces on athletes. J. R. Mureika built a physics-based model in 2001 that found that in the outdoor 100 m, “every 1000 m of altitude provides an advantage of roughly 0.03-0.04s”. Naively scaling to the 60 m would correspond to a ~0.02–0.03 s advantage for every 1,000 m. This matches the old NCAA conversions, which added 0.02 s to 60 m times between 3,000 and 6,000 ft (≈ 1,000–2,000 m) and 0.04 s to 6,000+ ft (≈ 2,000 m).
Mureika’s model was purely based on physics. What do the data show? Nicholas Linthorne, using 100 m Olympic finals between 1964 and 2012, found that Mexico City’s altitude (2,250 m) conferred an advantage of 0.19 s for men (and 0.21 s for women). Naively scaling Linthorne’s result to 60 m would produce advantages of ~0.046 s at 3,000 ft and ~0.093 s at 6,000 ft. However, drag increases quadratically with speed, so we should expect the majority of the 100 m advantage to be concentrated at top speed—and a smaller adjustment is likely warranted for the 60 m. And the data agree:
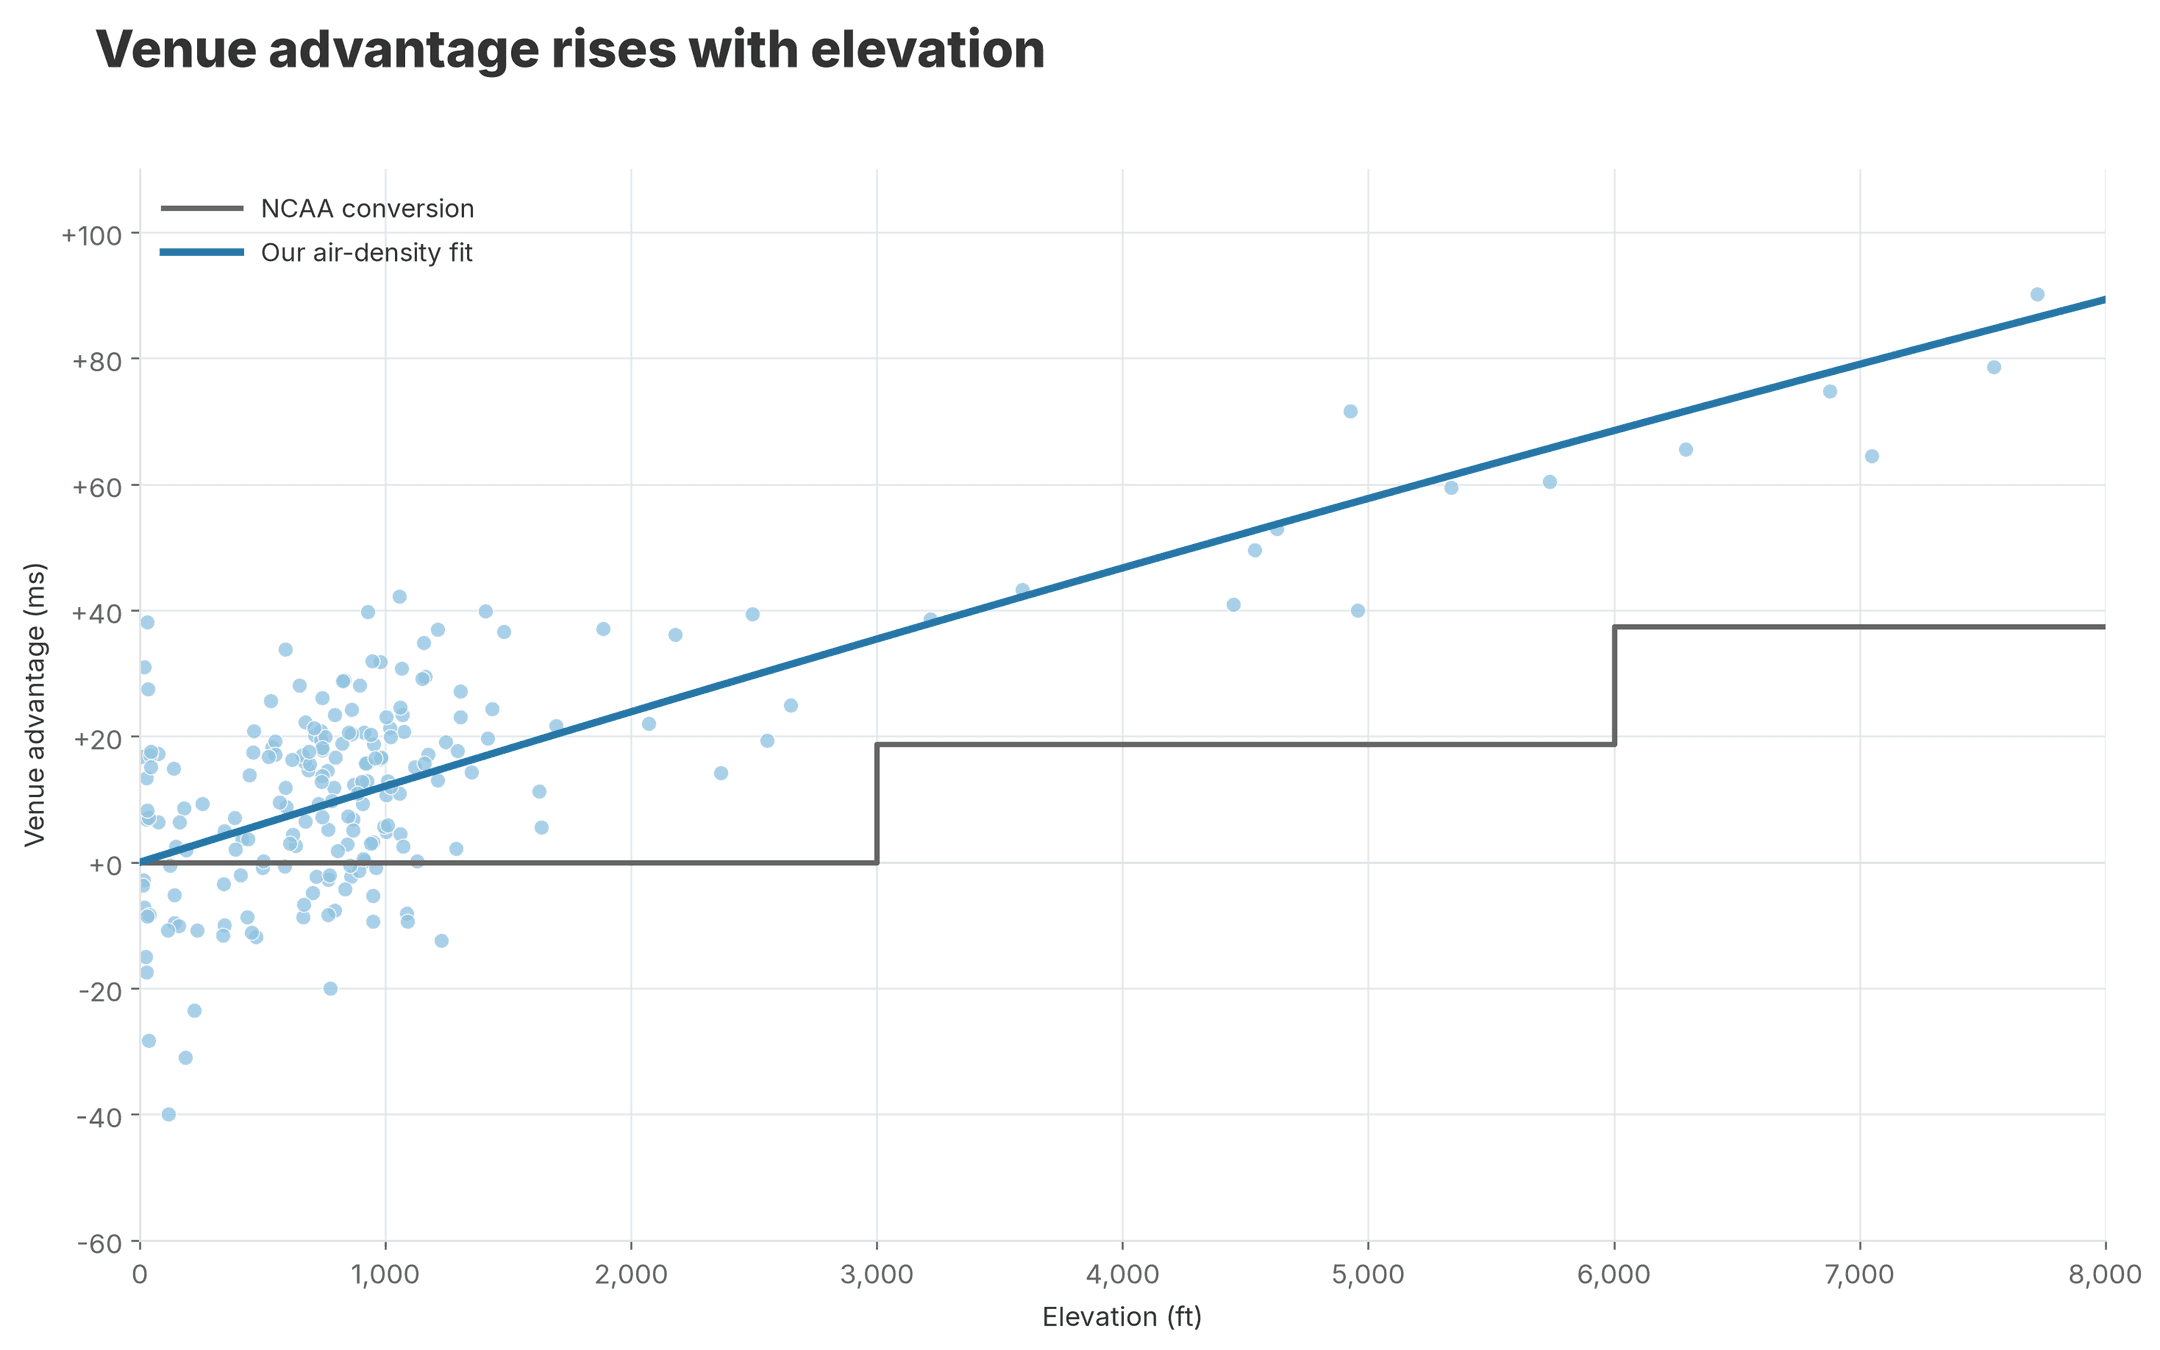
Our line looks much better than the NCAA’s! We estimate a 0.037 s advantage at 3,000 ft and 0.071 s at 6,000 ft, almost twice as large as the NCAA conversions, but about 80% as large as naively scaling Linthorne. We also more closely match the true advantage by venue: the R² of the fit is 0.555, as compared to the NCAA’s R² of 0.339.
What altitude can’t explain
Even our new conversion leaves about half of the venue variance unexplained. Boston is a good case study here, with four major indoor tracks (BU, Harvard, MIT, and the TRACK at New Balance) at essentially the same altitude. Yet there’s a 48 ms gap between the fastest and slowest Boston tracks.
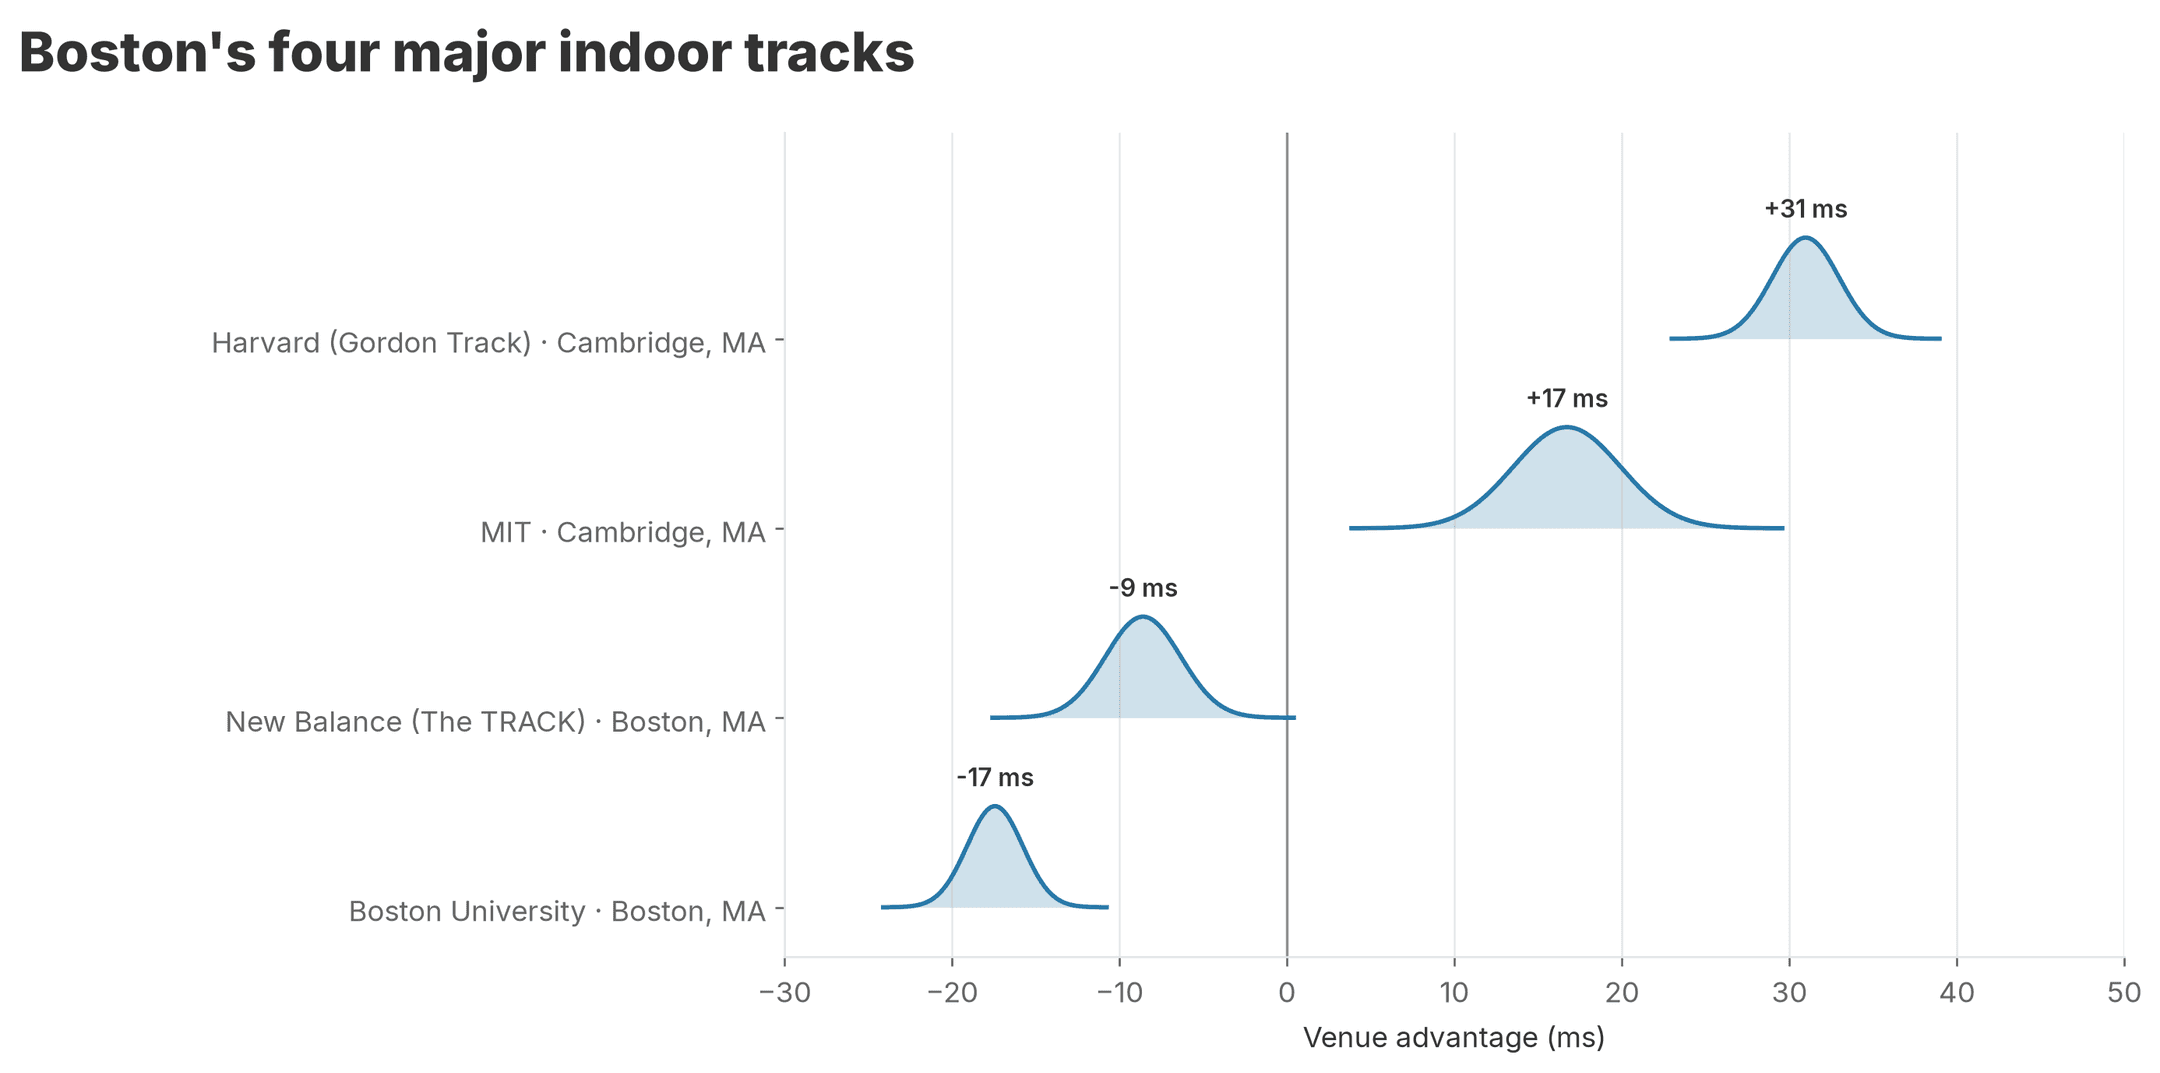
We can also run the comparison using only athlete-seasons with results from at least two of the four Boston venues, with a similar result:
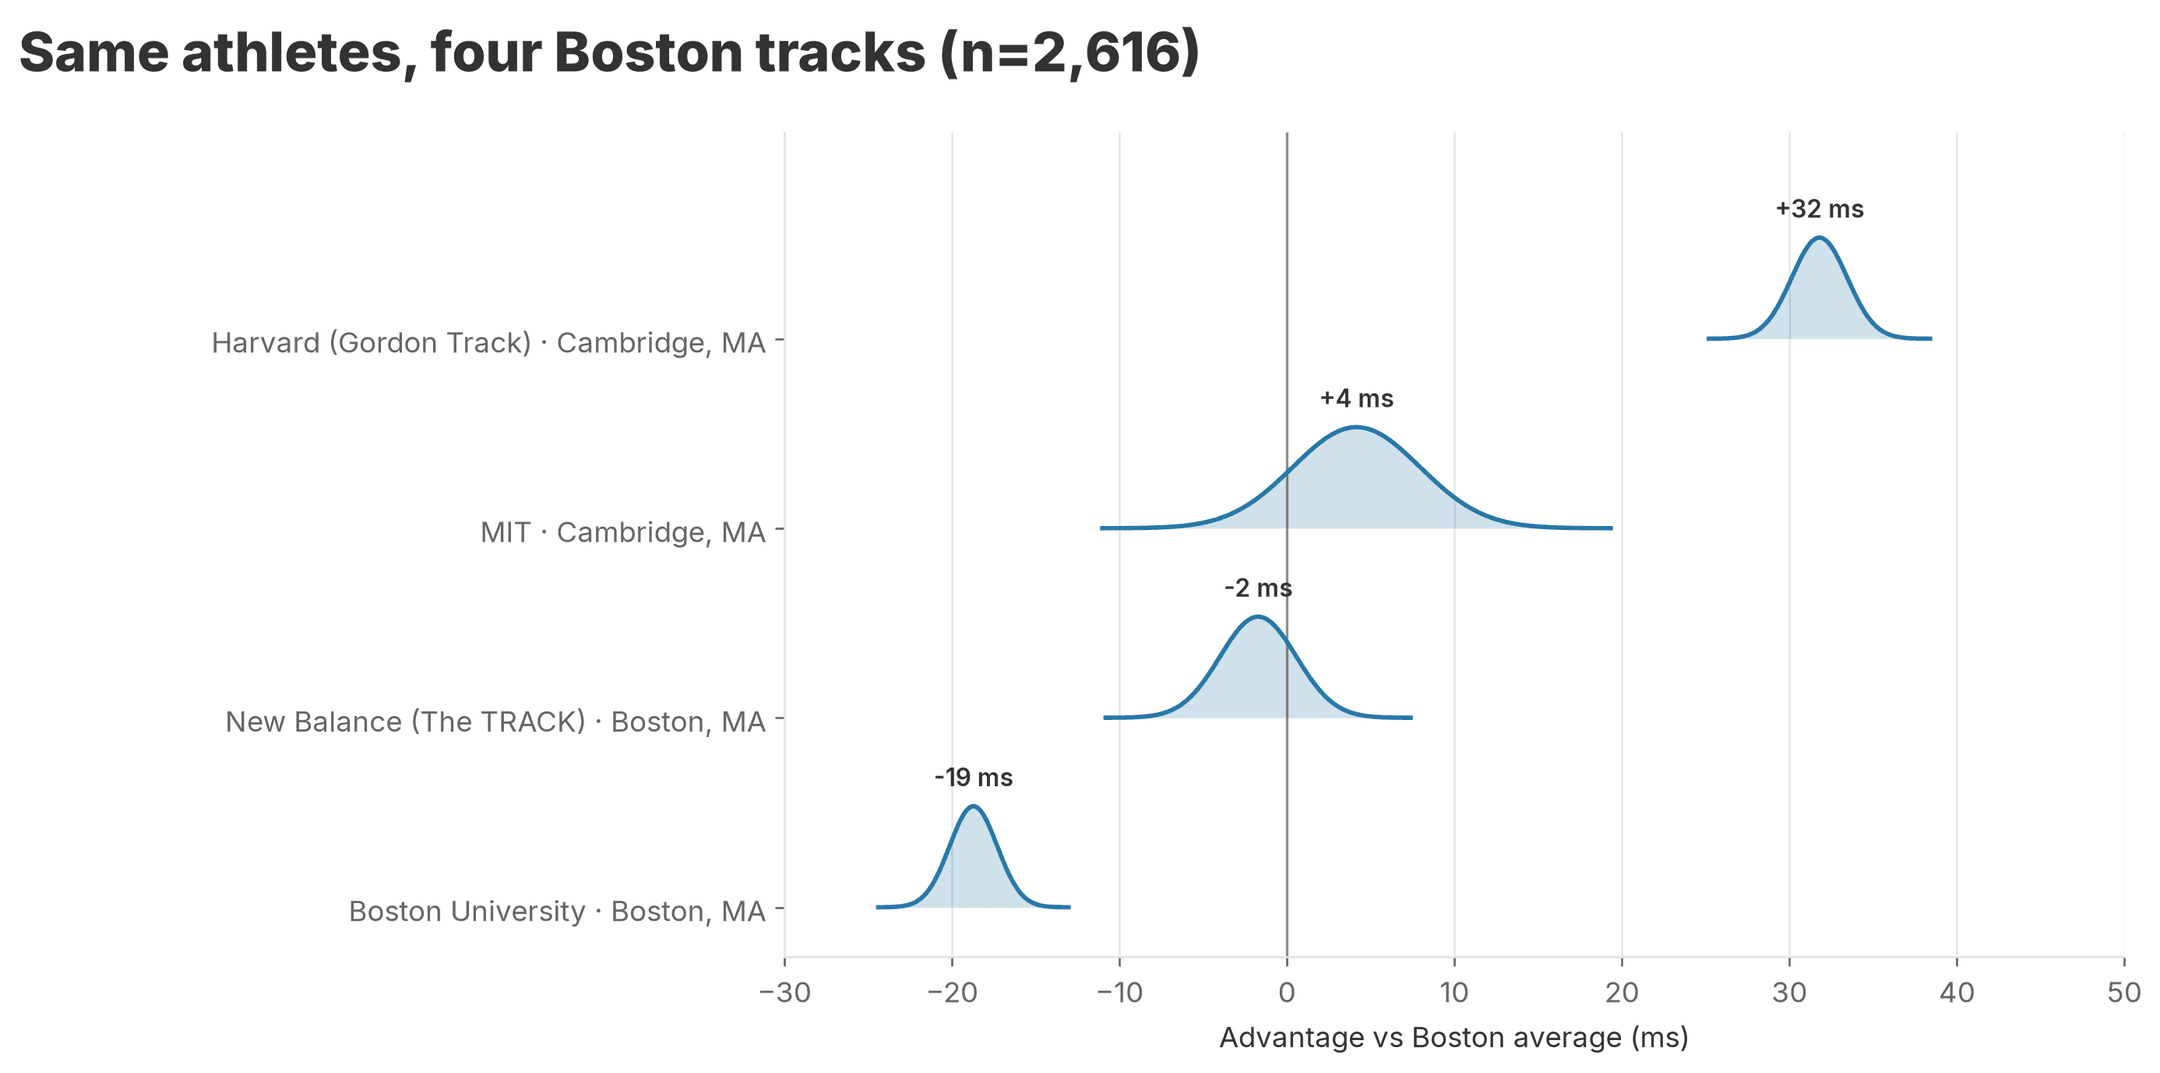
Despite BU’s sterling reputation for being one of the fastest indoor tracks in the world for distance events, we find that its short sprint performances are disappointing.
What might explain the differences here? Unfortunately, the model has no answers. Some possible mechanisms include the track surface (and subsurface), track age, building temperature, and timing discrepancies. My favorite mechanism, also unjustified, is that the distance from the finish line to the bank and crash pads psychologically affects athletes—nobody likes to sprint at a wall.
Some other surprisingly fast venues for their altitude include Doden Fieldhouse in Cedarville OH (+42 ms at just 1,056 ft) and Heskett Center in Wichita, KS (+40ms at 1,407 ft).
Knowing that venue effects exist, and that they are about as strong as altitude effects, we can combine them to answer the question: what’s the fastest indoor track in America?
The fastest indoor tracks in America
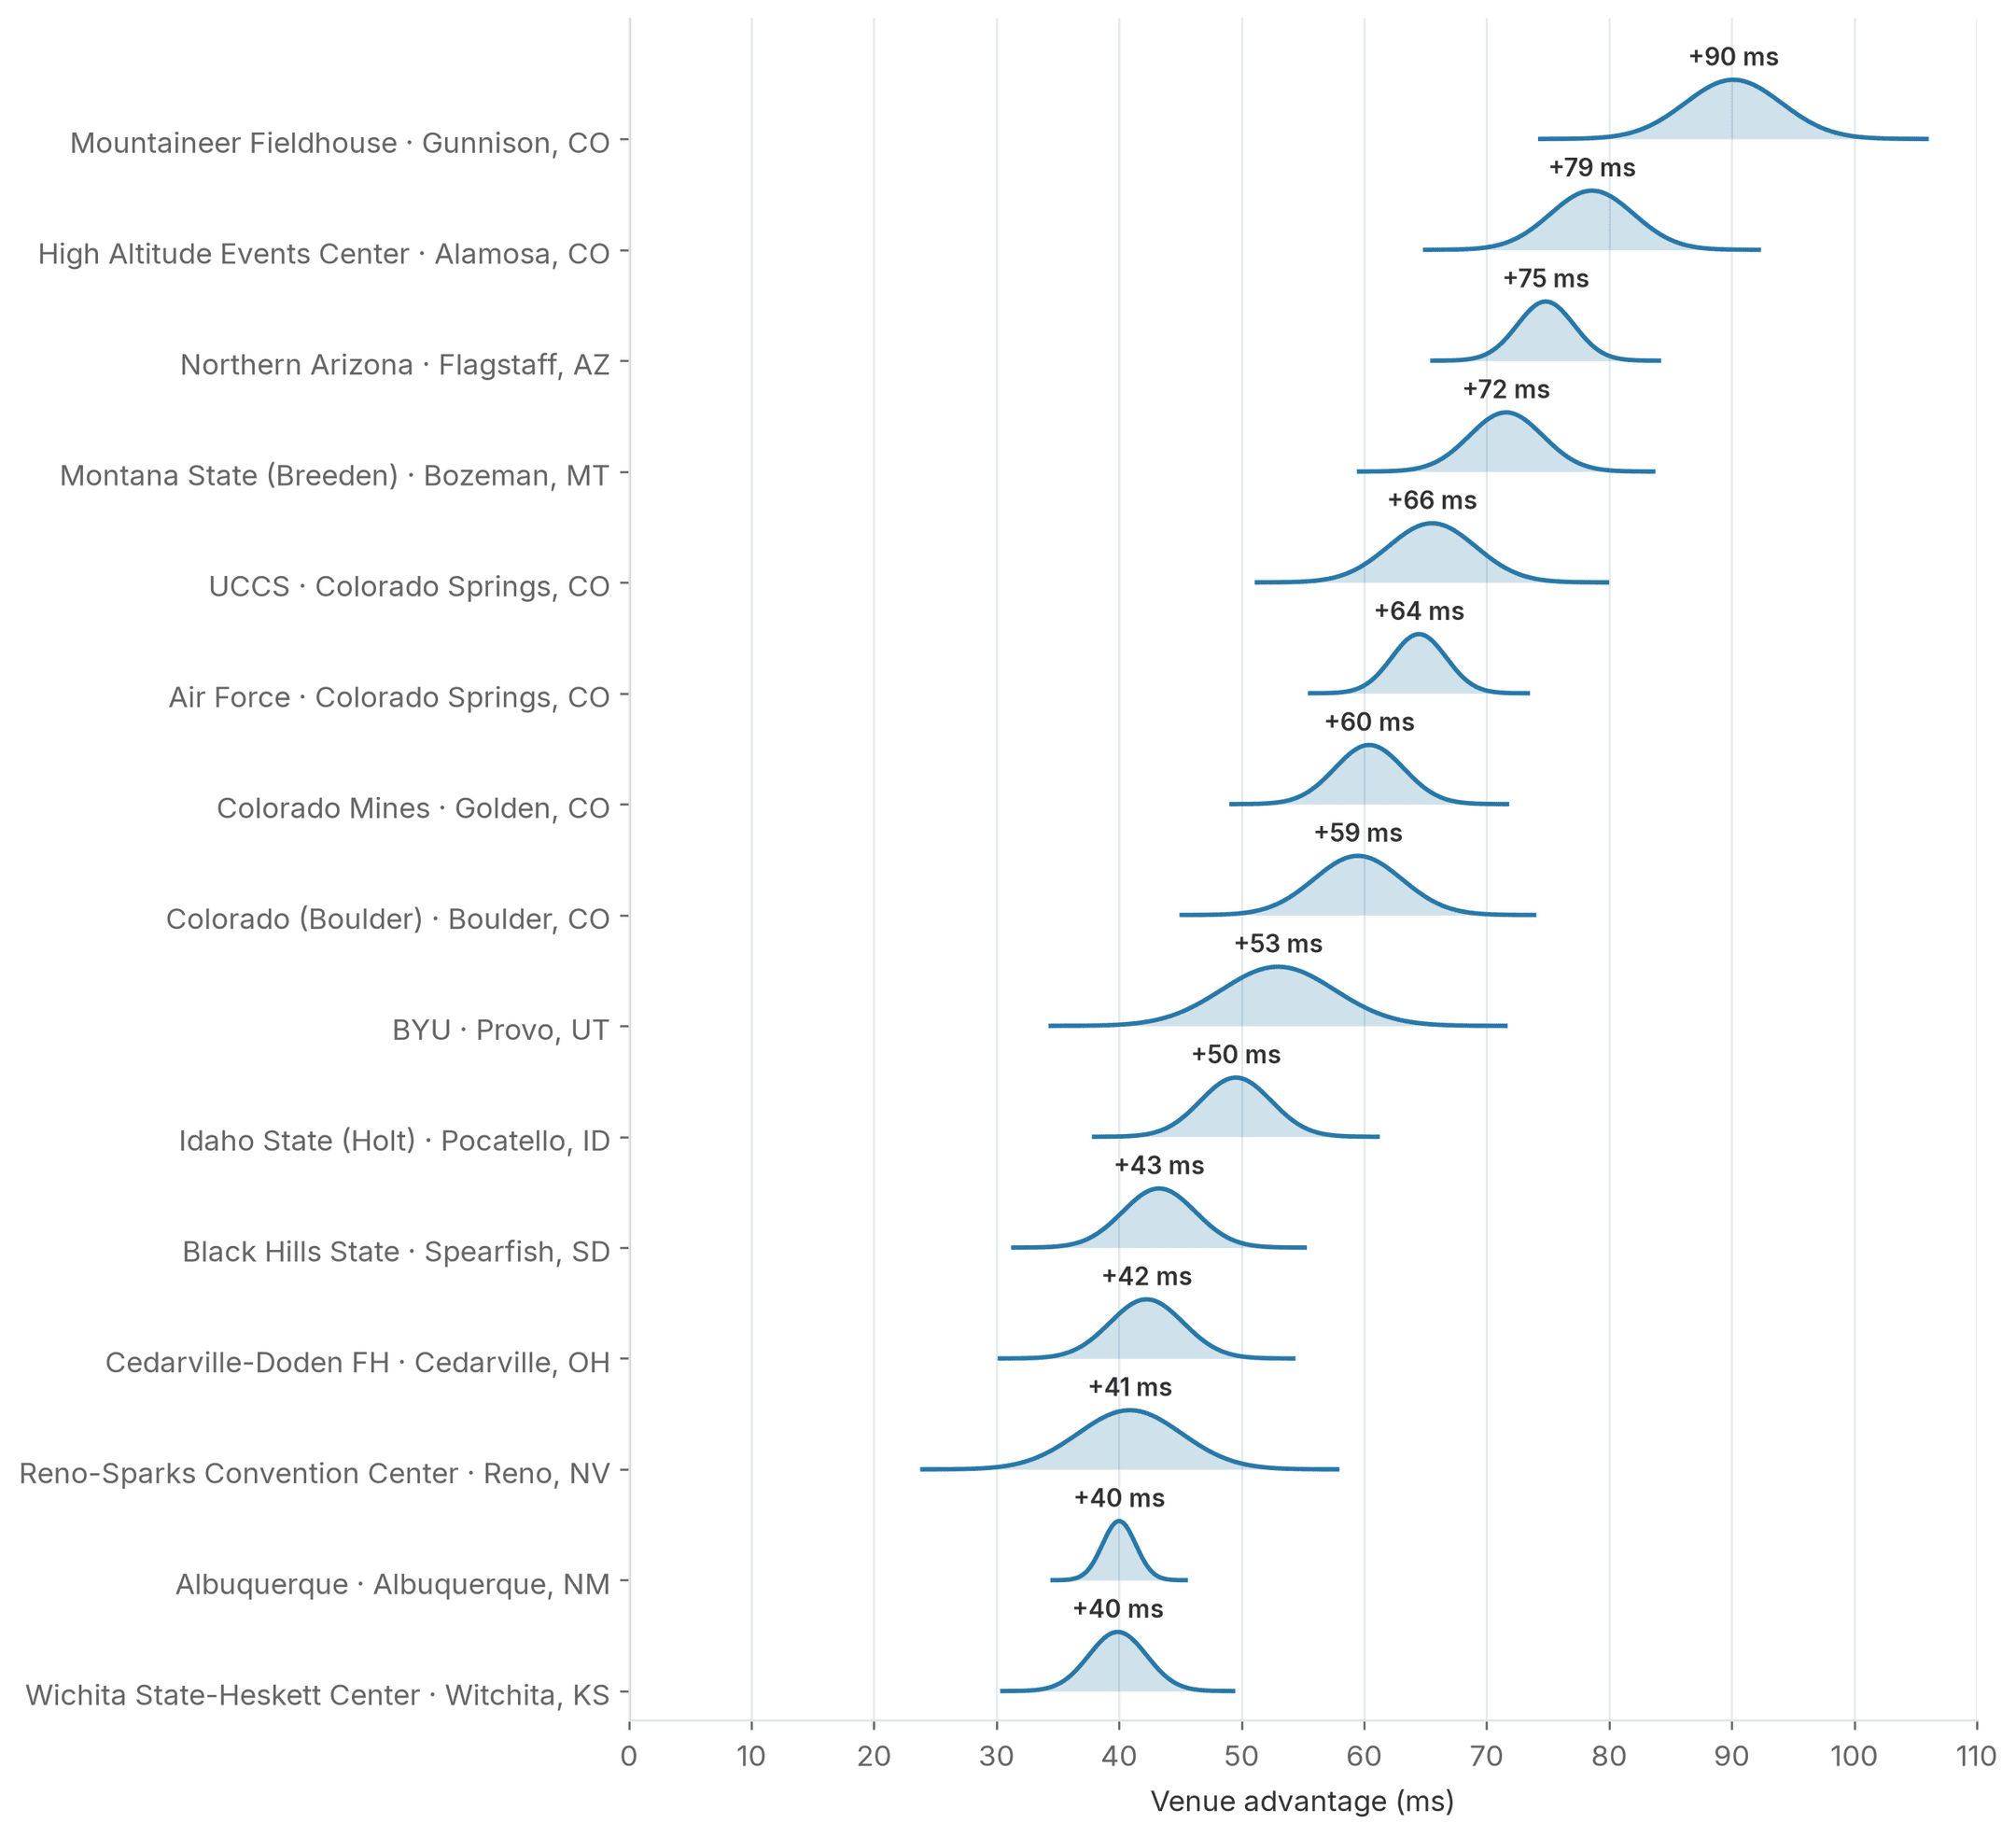
First, how to read this: venue advantage is defined as the advantage a venue has over the median sea-level venue, including altitude effects and any other venue effects as described above.
The two fastest tracks are Western Colorado’s Mountaineer Fieldhouse in Gunnison, CO, and Adams State’s High Altitude Events Center in Alamosa, CO. If you’ve been paying attention, you’d expect this result: these are the two highest tracks in the nation at 7,723 and 7,547 ft, respectively. But despite just 176 ft of altitude separating the two, WCU’s track in Gunnison is faster (11.5 ms, 95% CI 1.8–20.4 ms) than Adams State’s. This is evidence that altitude is not the only venue-level effect at play, as we explored in the previous section.
To put WCU’s 90 ms advantage over sea level in perspective: that’s the difference between the world record (6.34) and being out of the top 10. It’s a bigger advantage than the controversial superspike revolution (often cited as ~0.02–0.04 s in sprint events). Any top-level sprinter would be thrilled to improve by 90 ms over several seasons, let alone possibly in a single race.
With the new altitude rules, it’s hard to imagine P4 coaches not seeing these data and salivating. Indoor NCAAs take the top 16—that cutoff was 6.58 in 2026. If 2027 has similar athlete quality, an athlete who runs 6.67 at sea level—73rd on the 2026 NCAA list—could plausibly travel to Gunnison, race a 6.58 with no improvement, and qualify for nationals. NAU is already a popular destination for sprinters and jumpers; I expect the meet attendance at the other schools on this list to increase sharply over the next few years as well. I also wouldn’t be surprised to see WCU and Adams State become Division II sprint powerhouses once Division II follows Division I in dropping altitude conversions.
Methodology
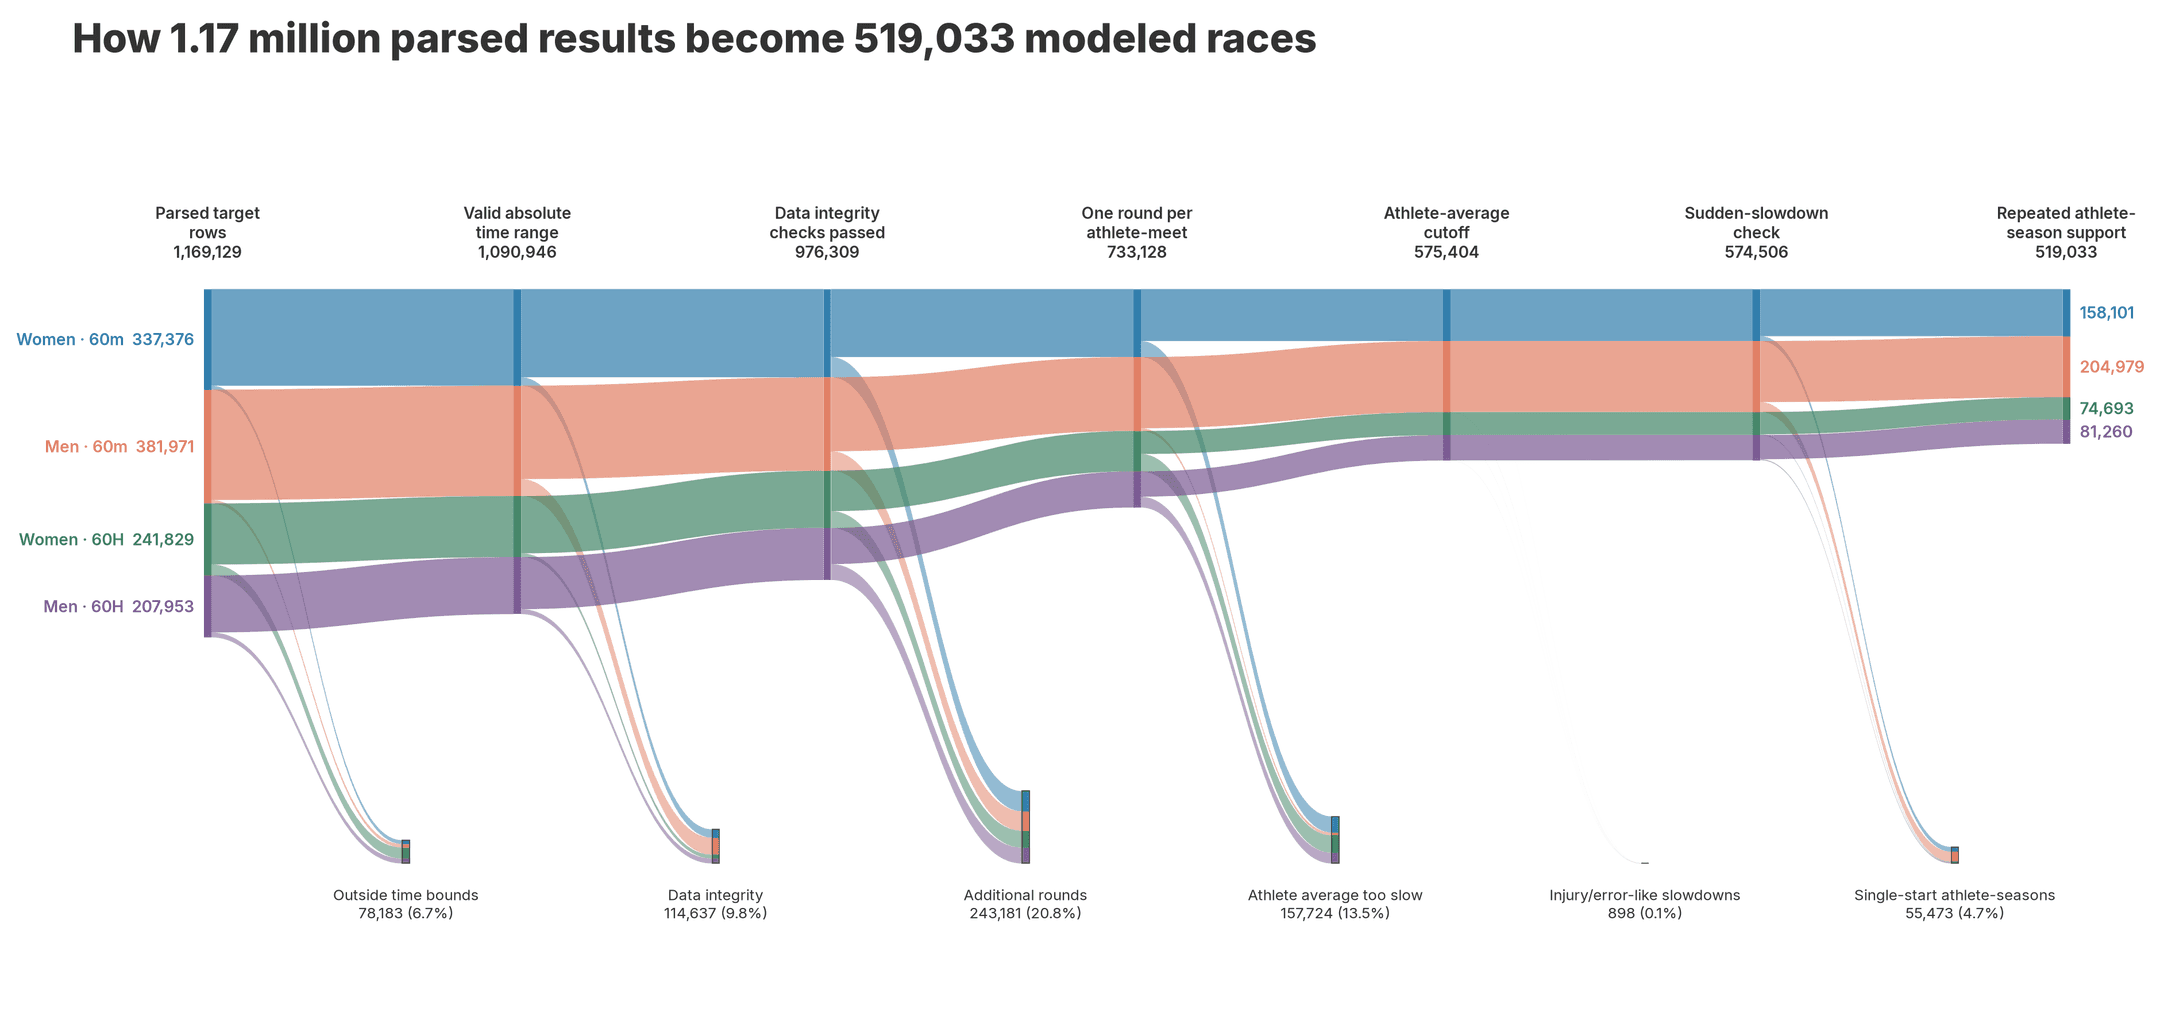
This is the nerd section. First, the data source and cleanup:
- pulled all 2007–2026 indoor data from TFRRS, filtered to 60 m / 60 mH across both genders
- grouped results by TFRRS ID, then also matched by name, school, and year
- filtered out unattached athletes, non-indoor races, results that were obviously too slow, all results marked FS, DNF, or DNS, all hand-timed and converted marks, and any implausibly slow results for a given athlete (which implies injury or data error)
- for meets with multiple rounds, we kept only first-round performances, which is the least bad option: no finalist selection effect, no finalist double-inclusion, no priming effect
- merged inconsistent venue names, filtered out venues with fewer than 500 total results
Overall, this pipeline started with roughly 1.2 million raw results and ended with roughly 519,000. Then, confounders and adjustments:
- per-event-gender 4-DoF spline for athlete seasonality (this deserves its own blog post, coming later)
- athlete quality: normalized by athlete-season-event
- models fitted in log space to normalize across events and genders
- Student’s t-distribution weighting on results to reduce the influence of unusual performances without discarding them
- empirical Bayes shrinkage to pull small or noisy venue estimates toward the median
And some robustness checks:
- leave-one-season-out stability
- home-team exclusion
- pairwise comparisons of athlete performances recorded within the same month
- per-gender/event models
- normality of venue effects after altitude adjustment
- sensitivity test to athlete ID matching
- future-venue placebo test
Coda
The NCAA memo eliminated conversions in part because “conversions are not applied for other conditions such as heat, humidity, etc.” That’s true: only about half of our observed venue effect is explained by altitude. Big-budget schools will always have an advantage, and an updated altitude conversion won’t fix that. The other claims, however, don’t stand up: there certainly is science to back up the altitude advantage for sprints, and that population-level average is large even if individual advantages vary.